Debugging deadlocks in C++ code with Visual C++
I’m currently adding some functionality to a server that I wrote, using The Server Framework, for a client last year. The server provides application gateway services for them. The new functionality is to switch to using asynchronous connect calls using ConnectEx when it’s available on the platform that the server is running on and to continue to use a blocking connect if ConnectEx isn’t available.
As I mentioned in the posting back in Feb 2004 the performance counters that we add to these kinds of servers are invaluable in tracking down problems. Unusual life-signs indicate internal wierdness ;)
Today I finished making the ConnectEx changes and discovered, not too surprisingly, that we had a deadlock occurring in some situations. I thought I’d write about the steps that I use to debug and fix these kind of things because, once you know them it’s pretty easy and until you learn it can be a bit of a nightmare.
The server accepts connections from clients and then links the clients to remote servers; it acts as a gateway. It caches outbound connections for later reuse and these connections can be set to close after a certain amount of inactivity. The new code is in the outbound connection establishment code and when I first thought about making this change I realised that there was a pretty high likelihood that I’d introduce a deadlock if I wasn’t careful. Given that I had tests which had caught similar deadlocks in the past I wasn’t too concerned by this and made the changes and ran the tests. I had made the mistake I was expecting and my tests caught it, which was cool ;)
The reason that this server is prone to deadlocks is that there are locks associated with the incoming connections and locks associated with the outbound connections and certain operations require taking out both locks. Things are fine as long as you abide by the rules, always acquire multiple locks in the same order. The good thing is that the tests we have for the server show up these problems pretty quickly and once they’re fixed there is no problem. Automatically running 100 or so concurrent test clients against the server and having them connect, flow data and disconnect multiple times seems to flush out these problems pretty reliably and the problem itself is easily identified from the performance counter traces; if the number of IO threads processing work items stays at the maximum and the CPU used drops to 0 then the IO thread pool has deadlocked.
Anyway, the purpose of this posting is not to explain why I made the mistake but rather to show how it can be relatively easy to track down these kinds of problems if you know what you’re looking at.
The first step in locating the problem is to run the server in the debugger and run the test harness against it until it deadlocks. For us this is easy to achieve and it usually doesn’t take very long to reproduce the problem. For those of you without appropriate tests it may take longer.
Once the server has deadlocked you need to pause debugging by selecting Break from the Debug menu. This may take a moment as the system is deadlocked, but eventually you’ll drop into the debugger.
The next step is to examine what the threads in the system are doing. By selecting Threads from the Debug menu you’ll get a display like this:
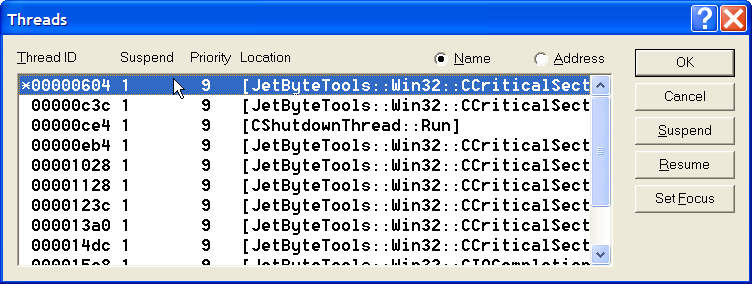
DebuggingDeadlocksThreadList
There are 12 threads in total, of those 8 are threads from our IO thread pool (quad processor, 2 threads per processor), 2 are the listening threads from our inbound and outbound socket servers, 1 is the thread that deals with service control messages and one the main application thread that spends its entire life sitting and waiting on an event that will tell it to shutdown. 10 of the threads are blocked on critical section locks.
The first thing you’ll notice is how easy it is to see that there are threads blocked on critical sections; this is because every critical section we ever use, anywhere, is always used by using our CCriticalSection wrapper class. The class is similar in design to the CEvent class that I talked about here, it manages the resource lifetime, converts errors into exceptions and provides the interface that we need to work with the underlying Win32 API. Without such a class, or without the consistent use of such a class it’s considerably harder to glance at the threads display and see exactly who’s waiting for a lock…
Since all of the IO threads are deadlocked it doesn’t really matter which one we start with. Double clicking the first thread (ID 0x00000604) gives us this call stack:
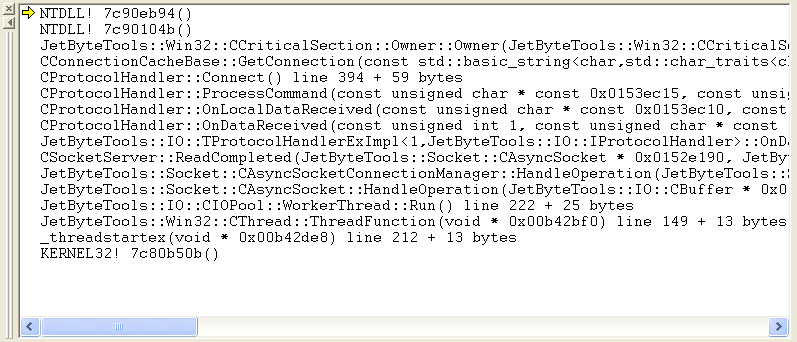
DebuggingDeadlocksCallStack1
We’re blocked trying to take ownership of the critical section that is used inside of CConnectionCacheBase::GetConnection(). Double clicking on that line allows us to take a look at the critical section in the watch window.
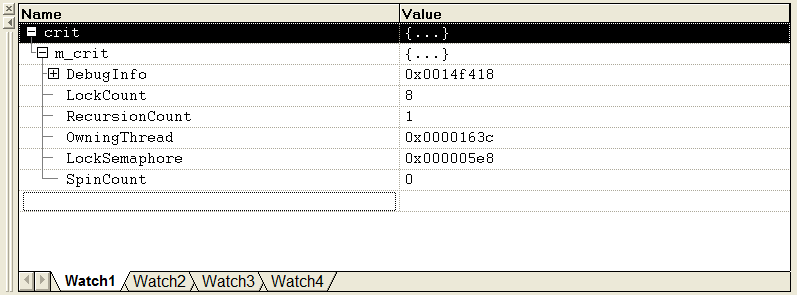
DebuggingDeadlocksCrit1
This is a watch window that has been drilled down into the underlying CRITICAL_SECTION structure. There’s no magic here, none of this stuff is there because of our wrapper classes, it’s all standard Win32 stuff. The important thing is the OwningThread, which is 0x0000163c which gives us the thread that holds the lock that our thread, 0x00000604, needs. If we go back to the threads display, find and click on thread 0x0000163c then we end up with this stack trace:
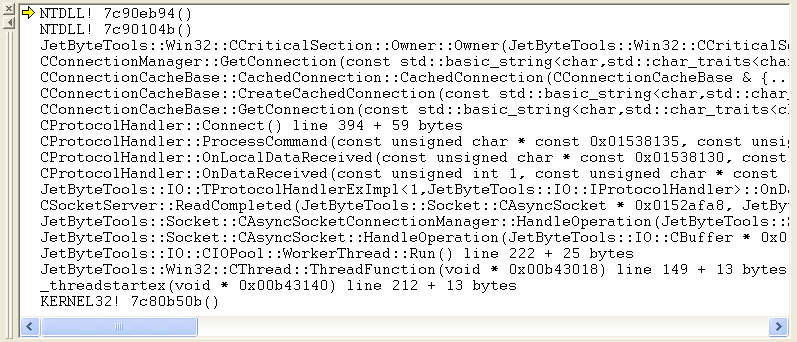
DebuggingDeadlocksCallStack2
This thread is blocked on a critical section in CConnectionManager::GetConnection(). Examining the critical section in the watch window tells us that this critical section is owned by thread 0x00000c3c. The callstack for this thread is:
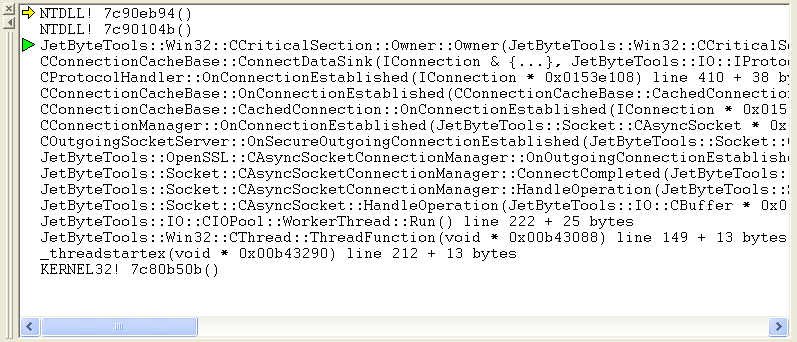
DebuggingDeadlocksCallStack3
Examining this critical section shows that it’s locked by thread 0x000016c3, so we’ve found our deadlock. 0x000016c3 holds lock 1 and wants lock 2. 0x00000c3c holds lock 2 and wants lock 1.
Of course, finding the deadlock is one thing, fixing the bug that led to it is something else entirely, but until you can locate the deadlock all that you can do to fix the bug is to analyse the source and hope that you see where you’re breaking the rules of your lock hierarchy. Debugging deadlocks is pretty straight forward once you know how, assuming, of course, that you can duplicate the problem in the debugger.
This particular bug was due to the fact that I was failing to lock the connection cache before calling back into the protocol handler. The lock hierarchy for this server is such that the connection cache must always be locked before callbacks into the protocol handler for a connection. The design could be better, but it works and if we decide to change the design at least we have tests to support us.